Skip to content
Japanese knotweed, the UK’s most invasive plant, continues to pose a significant threat to properties across England and Wales – and thanks to Environet’s newly upgraded interactive heatmap, the full extent of this botanical menace is more visible than ever. Now featuring over 100,000 known incidences and refreshed with newly verified sightings throughout the year, this comprehensive tool is the go-to online resource for tracking Japanese knotweed infestations.
Bristol leads the way in England
At the top of the 2025 rankings is Bristol, with an astonishing 33.91 infestations per square mile, earning it the title of England’s Japanese knotweed capital. Following closely behind are Merseyside (11.87 per mi²), Greater London (7.74 per mi²), and Lancashire (7.25 per mi²).
These figures account for the size of each unitary authority, providing a clearer picture of intensity, rather than just volume.
England’s top 10 Japanese knotweed hotspots – 2025
| Rank | County/Region | Total Incidences | Incidences per mi² |
|---|---|---|---|
| 1 | Bristol | 1,440 | 33.91 |
| 2 | Merseyside | 2,963 | 11.87 |
| 3 | Greater London | 4,687 | 7.74 |
| 4 | Lancashire | 8,612 | 7.25 |
| 5 | Greater Manchester | 3,558 | 7.22 |
| 6 | Isle of Man | 982 | 4.45 |
| 7 | Channel Islands | 301 | 3.94 |
| 8 | Isle of Wight | 554 | 3.77 |
| 9 | Derbyshire | 3,427 | 3.38 |
| 10 | Nottinghamshire | 2,091 | 2.51 |
Welsh knotweed hotspots revealed
Wales is no stranger to knotweed infestations, with dense clusters found across both urban and rural locations. In 2025, Newport takes the top spot with 1,747 known incidences, followed by the Welsh capital Cardiff with 1,208 and Bridgend with 1,209. These urban centres are seeing high concentrations, but more rural counties are not immune, with Gwynedd, Rhondda Cynon Taf, and Merthyr Tydfil also ranking in the top 10.
Top 10 Japanese knotweed hotspots in Wales – 2025
| Rank | Location | Total Incidences | Incidences per mi² |
|---|---|---|---|
| 1 | Newport | 1,747 | 23.81 |
| 2 | Cardiff | 1,208 | 22.35 |
| 3 | Bridgend | 1,209 | 12.73 |
| 4 | Swansea | 1,690 | 11.52 |
| 5 | Neath, Neath Port Talbot | 1,820 | 10.69 |
| 6 | Merthyr Tydfil | 418 | 9.75 |
| 7 | Caerphilly | 935 | 8.71 |
| 8 | Rhondda Cynon Taf | 1,283 | 7.84 |
| 9 | Gwynedd | 6,216 | 6.35 |
| 10 | Torfaen | 304 | 6.25 |
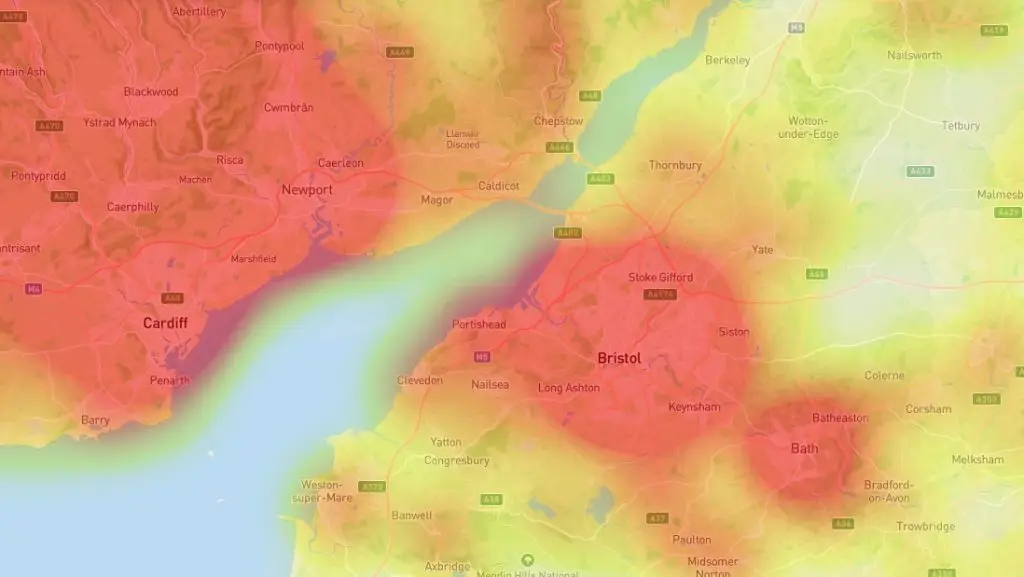
The power of the heatmap
Environet’s map is not just for browsing past data. It is updated year-round with new verified sightings, making it a dynamic resource for homeowners, buyers, and surveyors. Entering a postcode reveals local knotweed densities, colour-coded by risk level:
🟡 Yellow – Low
🟠 Orange – Moderate🔴 Red – High
Users can also help improve the map by reporting new infestations. Using the ‘Add Sighting’ tool, they can upload a photo for expert verification, contributing to the UK’s largest knotweed database.
Why it matters
Japanese knotweed can cause structural damage, reduce property value, and make it harder to secure mortgages. Awareness is key – especially for buyers, developers, and anyone looking to manage their land responsibly. For those looking for a comprehensive analysis – we also have KnotSure – harnessing the power of the heatmap.
Check your postcode today
Visit Environet’s Knotweed Heatmap to see if knotweed is growing near you. Whether you’re buying, selling, or staying put, understanding the risks in your area has never been easier.